Posts

Showing posts from February, 2017

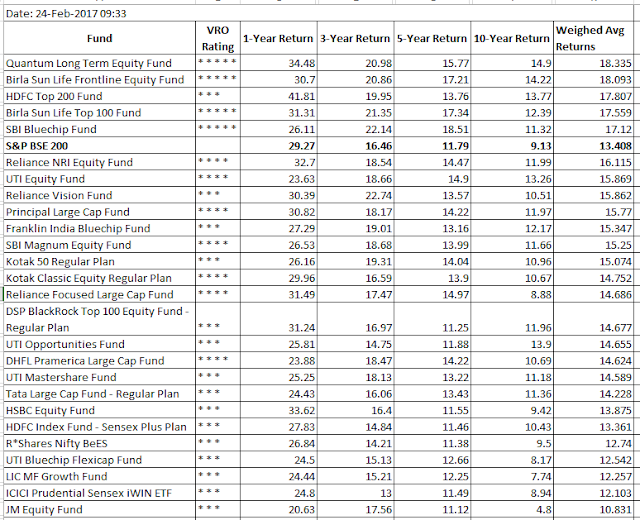
Top 5 equity mutual funds in each category with consistent returns

Image
In my earlier post I laid down some rules to evaluate Large Cap funds http://moneybhasa.blogspot.in/2017/02/top-5-large-cap-mutual-funds-with.html In this post I will evaluate all equity mutual funds in different categories in a single post Large cap  Muti cap Mid/small cap Tax planning ELSS funds  The criteria remains same and reproducing it below. The fund should have at least 10 years of history. The data from value research is used which lists returns over 1-year, 3-year, 5-year and 10-year periods. The  returns are as on date 24-Feb-2017. The weighed average return is calculated by assigning following weights based on duration of returns. Annual compounded returns are taken into consideration. For 10 year returns weight is  40 out of 100 For 5 year returns weight    is  30 out of  100 For 3 year returns weight    is  20 out of 100 For 1 year returns weight    is  10 out of 100 Hence formula for weighed average returns Weighed Average returns =  (40*

Top 5 Large cap Mutual Funds with consistent returns

Image
The idea of this  post is to select and rank large cap funds based on consistent return over long period of time. Selecting funds pose a real challenge as the number of funds in each category keeps on increasing. Also over different period of time there is huge variation in  returns for Mutual Funds. For example a fund with great 1 year or 3 year returns may not perform good over a 5 year or 10 year period . Therefore I laid down some criteria  to pick the fund taking into consideration returns for all possible periods from 1 year to 10 year, with higher weight for long term returns. This way we can filter signal from the noise and also overcome our inherent biases. The criteria and methodology is listed below. The fund should have at least 10 years of history. The data from value research is used which lists returns over 1-year, 3-year, 5-year and 10-year periods. The  returns are as on date 24-Feb-2017. The weighed average return is calculated by assigning following weight

Interesting Readings

Morningstar's CEO shares some fund picking advice Days of 8-9% return from liquid funds are over' What scares me in a mutual fund today Do’s and Don’ts of Debt Mutual Fund Investing When mutual funds say no to your money

Mutual Funds v/s Stocks by Mr Debashis Basu

Image

Interesting readings

Confused investors The NIFTY 100 Equal Weight Index As a Mutual Fund Benchmark The beginner investor's dangerous journey Nifty, Sensex Lacks Momentum - Weekly closing report What ails the economy?

Can Sensex returns be predicted based on PE ratio

Image
Morningstar had published statistical analysis to predict the sensex returns for 2 years based on overall sensex PE (Price to Earning) ratio. http://www.morningstar.in/posts/36274/how-investors-can-use-the-pe-ratio.aspx The results are interesting and give us fair idea where sensex might be headed in coming 2 years. For example if Sensex PE is in range 16-17 the model predicts 26% return over two years and  actual returns have been 28%. As of Feb 2017, the Sensex is sitting on PE of 21.96 and according to model it predicts 1 percent returns over next two years, not a good sign indeed.  It would interesting to visit the post in two years time, to validate the prediction. The  historical Sensex PE can be obtained from BSE website http://www.bseindia.com/markets/keystatics/Keystat_index.aspx?expandable=2 But having said that if you are investing through SIP with long term view , it should not bother you. For those who invest in individual stocks, its good idea to pick up q

Why investing in stock market is perceived as risky and how can we minimize the risk.

Image
There is general perception that investing in equities is risky. Can the perception be changed by  some kind of facts and  data visualization?  In short answers is yes and proof lies in numbers. So I undertook this study of historical returns from BSE Sensex and since this index has history of 35 years its perfect barometer for long term returns from Indian stock markets. I calculated BSE Sensex rolling returns for 1 year, 3 year, 5 year, 10 Years and 20 Year for past 16 years and the results as as follows. Sensex Rolling Returns Rolling returns is the annualized average return for a period ending with the listed year.  So 3 year rolling return for year  2003 means annual compounded returns for preceding three year from 2000 to 2003. Now lets convert numbers into graphs. The 1 year returns for every year from 2000 to 2016 is depicted below. This is a very scary graph in may ways. The returns are unpredictable and in some years returns are negative, and appear risky.

Why only a small percentage of Indians Invest in Mutual Funds?

I answered the question on Quora . There are many factors, some of them I can list down based on personal experience. Indians invest majority of income on house and gold and that leaves them little to invest in other avenues. Financial education has not yet caught up to educated people of our country. There are many  among us who are unaware of the fact that  Long Term Capital Gains from equity mutual funds are tax free. There are many misconceptions regarding equity investments, for example trading in shares and investing in shares is considered as same thing . I would also partly blame the Investment agents (Banks, LIC, Insurance), often giving wrong advice to customers. Insurance is mixed with investments which are separate things. Everyone wants to get rich quickly so the time horizon for investment is very less. Over a short period of time Mutual Funds or Equities deliver unpredictable returns, but people often overlook the power of compounding over large period of time.

Best advise ever received for mutual fund

I answered this question on Quora I have received many great advises thanks to one of blogs  Subramoney  and have benefited immensely from same. Some of them which I can remember are as follows. You only need 2–3 funds from good fund houses without need to constantly check their performance. Fund manager is more important than the Mutual Fund itself for delivering consistent returns. Fund Management cost has big impact on your overall returns, even a difference of 0.5 percent of FMC charges can shave off lakhs of rupees from your final returns due to inherent nature of compounding. Starting early is key to financial freedom. Don’t sell your fund just because it has few bad years, the fund manager might be having a contrarian view and he may be doing something different. For example HDFC Top 200 had some bad years, but it has now become one of the best funds again. Investing very less amount in Mutual Funds SIP compared to your income, is not going to make you wealthy. Many p

Volatility in equity markets is your friend, proof lies in numbers

Image
I hear a lot of friends, colleges, relatives and even my better half  afraid of investing in equities. To some extent the fear is justified as they have witnessed the events that unfolded in 2008 market crash. But what if told you that you could have profited from the crash and subsequent volatility. There are some assumptions that you need to be aware of. You have surplus income which you don't need for long period of time.  For most salaried people it is some portion of salary they can allocate for long term goals. You are willing to continue your sip with mutual funds with long track record and trust the Mutual Fund Manager  You believe in Indian  economy, and are willing to overlook the short term  set backs. If events like Brexit, Demonetization and Trumphication, give you sleepless nights then either change your thought process of stay away from equities. Lets take  HDFC top 200 Fund as an example which has long history of more than 20 years and Managed by wel

Are mid caps stocks overvalued?

Image
Mid-cap stocks are having good run on exchange since the General Election of 2014. The overall valuation can be judged by analyzing  the P/E graph for  NIFTY Free Float Midcap 100 since it was created, The P/E value for  NIFTY Free Float Midcap is hovering around 32 as of today, which is highest till date since the inception of this index. Even during  market crashes of 2006 and 2008 the PE was well below current value at around 26. The median value for PE for index  is 16.83 and mean is 17.6. Reversion to mean is well known phenomenon our mid cap stocks are showing no signs of retreat as of now, only time will tell. From behavioral aspect I can see more retail investors flocking to mid and small cap Mutual funds as the rate of interest on FD is declining. The index movement taken form  edelweiss  shows the following pattern. Note that the PE values and price values move in similar pattern from February 2014 own wards, which means price have been rising without any signi