Why investing in stock market is perceived as risky and how can we minimize the risk.
There is general perception that investing in equities is risky. Can the perception be changed by some kind of facts and data visualization? In short answers is yes and proof lies in numbers.
So I undertook this study of historical returns from BSE Sensex and since this index has history of 35 years its perfect barometer for long term returns from Indian stock markets.
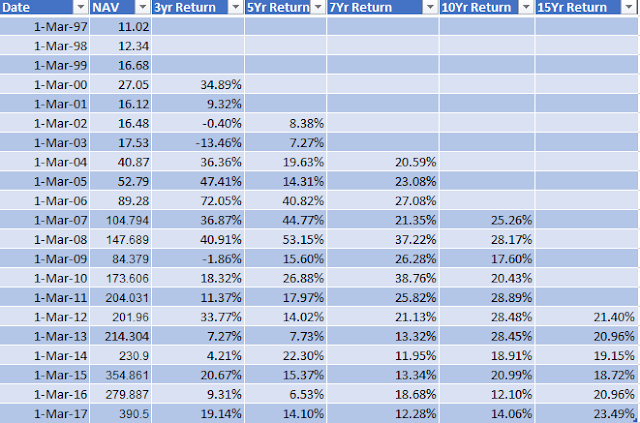
I calculated BSE Sensex rolling returns for 1 year, 3 year, 5 year, 10 Years and 20 Year for past 16 years and the results as as follows.
 |
| Sensex Rolling Returns |
Now lets convert numbers into graphs.
The 1 year returns for every year from 2000 to 2016 is depicted below. This is a very scary graph in may ways. The returns are unpredictable and in some years returns are negative, and appear risky.
When a common man looks at such kind of returns its natural to compare stock market with betting.
But it also tells us that in general people take very short term view of markets and in short periods the market is volatile.

The 5 year rolling returns graph have some better story to tell. Each point on graph depicts the preceding 5 year returns from Sensex for that year, Out of 16 years there were two instances when the returns were negative for a 5 year period . So it appears investment horizon of 5 years is not long enough to expect consistent returns.

Lets see the 15 years rolling returns, notice how returns have more or less become predictable.
So its safe to assume that if your investment horizon is 15 years, you will be rewarded nicely from equities.

Lets talk about relativity and compare 1 year returns and 15 Year returns in a single graph. Look how picture have completely changed. The 15 year return graph, is almost a straight line and you can walk on it eyes closed. One year graph on other hand looks like a dangerous road to travel,


Comments